Rainfall in Mississippi
Gregory E. Faiers and Barry D. Keim
Department of Geography, University of Pittsburgh at Johnstown, Johnstown, PA 15904, and
Department of Geography, University of New Hampshire, Durham, NH 03824
Accurate extreme 3-hour and 24-hour rainfall frequency-magnitude relationships
are essential for estimating erosion rates and for proper design of reservoirs,
artificial waterways, drainage networks, retention ponds and other water-related
structures. Currently, most users refer to Technical Paper No. 40 (TP40)
which is well over thirty years old. The purpose of this research is to
revise TP40 storm magnitudes for Mississippi using longer periods of record,
a more dense station network, and new statistical techniques. Forty-seven
sites were used to determine the quartile estimates with most of these
having periods of record in excess of 40 years. Rainstorm data at Jackson
and Meridian were tested for homogeneity and it was determined that no
extreme-value statistical assumptions were violated. Several probability
distributions were tested for best fit. However, an alternative log-normal
technique (called the SRCC method) was selected to determine the storm
frequency-magnitude relationships. Spatial patterns show a strong gradient
along the coast where the maximum storm magnitudes were found. Northward,
the storm magnitudes decreased at a more gradual rate. At some locations
in the southern part of the state, storm magnitudes were more than two
inches greater than previously estimated.
The state of Mississippi is periodically plagued by extreme rainfall and associated flooding. In fact, a recent study by Keim (1997) has shown that the Gulf Coast of Mississippi has the highest annual average occurrence rate of heavy rainfalls of any site examined in the entire Southeastern United States. As a result of these events, massive flooding has occurred along the Pearl River (1979 and 1983) and along the lower Gulf Coast (May 1995). Extreme 24-hour accumulations of rain can be produced by frontal systems, tropical storms or hurricanes and occasionally a combination of tropical and mid-latitude systems (Faiers et al., 1994b). Upper air disturbances and summer air mass storms can result in heavy short term bursts of rain and are responsible for some of the extreme 24-hour events and many of the shorter duration storms which can result in flash flooding.
To minimize impacts from these storms, civil engineers and water resource planners need access to accurate frequency and magnitude relationships of extreme rainfall for flood and erosion control measures to be effective. The document most often referred to for these purposes is the National Weather Bureau publication Technical Paper No. 40 (TP40) (Hershfield, 1961). This atlas is now well over thirty years old, used station data with an average period of record of only 15 years, and is national in scope, all of which restricts its application to current water resources needs in Mississippi. Recent updates of TP40 have been conducted for the Midwest (Huff and Angel, 1992) and Louisiana (Faiers et al., 1994a). Other documents related to extreme rainfall frequencies in Mississippi are also outdated (McWhorter et al., 1966) or focused on longer duration events, e.g., days to weeks (Wax and Walker, 1986). The purpose of this paper is to re-evaluate extreme 3-hour and 24-hour rainfall in Mississippi using long-term precipitation records (minimum of 25 years). The resulting maps will depict extreme rainfall more accurately and with more detail than appears in TP40.
MATERIALS AND METHODS
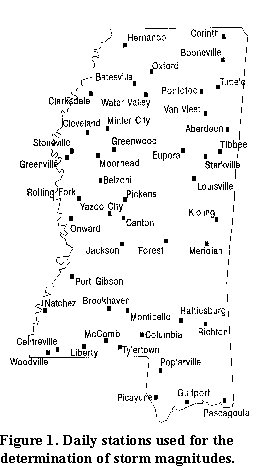
Daily rainfall data were selected over hourly data in this analysis because hourly records are of lower quality, are smaller in number which limits spatial coverage of Mississippi, and the periods of record for hourly data are shorter than that for daily observations. From the daily records, the largest extreme daily rainstorms were extracted from records at 47 sites across the state (Fig. 1). These sites were selected because of the length and completeness of their data. At each site, the number of 1-day storms extracted is equivalent to the number of years of record. This type of data series is referred to as a partial duration series, as opposed to the annual series which includes only the largest storm from each calendar year. The partial duration series is preferred because large events can be excluded in the annual series if two or more extreme events occur in a single year. Hence, we chose the x largest single day rain events at each site in which x equals the number of years of record. Quartile estimates derived from partial duration series are therefore considered more accurate, where a quartile estimate represents a return period (or recurrence interval) and an associated storm magnitude. If annual series data are used, the results are typically adjusted to partial duration series values (Hershfield, 1961; Dunne and Leopold, 1978).
Locations used in this study had a minimum period of record of 25 years, with an average record length of 46 years (Table 1). Given that some sites had missing days nested within their records, the number of actual recorded days was divided by 365 to give an equivalent number of "complete" years. Therefore, some sites had a significantly lower number of storms selected than would otherwise be expected due to a large number of missing observations (e.g., Moorhead had roughly nine years of missing data).
| Table 1. Stations included in the study, periods of record, and the largest daily storm event at each site. | ||||
| LOCATION | STA. | # OF YRS | # OF COMP. | YRS LARGEST |
| Aberdeen | 0021 | 43 | 41 | 7.14 |
| Batesville | 0488 | 44 | 42 | 8.85 |
| Belzoni | 0660 | 44 | 41 | 7.50 |
| Booneville | 0955 | 44 | 42 | 6.67 |
| Brookhaven | 1094 | 62 | 60 | 8.08 |
| Canton | 1389 | 43 | 42 | 5.67 |
| Centreville | 1578 | 35 | 31 | 10.00 |
| Clarksdale | 1707 | 62 | 60 | 6.07 |
| Cleveland | 1738 | 60 | 59 | 6.35 |
| Columbia | 1865 | 62 | 61 | 13.70 |
| Corinth | 1962 | 62 | 59 | 6.33 |
| Eupora | 2896 | 44 | 41 | 7.89 |
| Forest | 3107 | 62 | 60 | 10.04 |
| Greenville | 3605 | 72 | 70 | 8.12 |
| Greenwood | 3627 | 44 | 43 | 8.07 |
| Gulfport | 3671 | 44 | 41 | 10.70 |
| Hattiesburg | 3887 | 44 | 42 | 10.68 |
| Hernando | 3975 | 62 | 57 | 8.20 |
| Jackson | 4472 | 29 | 27 | 6.97 |
| Kipling | 4702 | 44 | 43 | 6.25 |
| Liberty | 5070 | 43 | 40 | 7.85 |
| Louisville | 5247 | 62 | 60 | 10.25 |
| McComb | 5614 | 44 | 42 | 10.98 |
| Meridian | 5776 | 44 | 43 | 7.99 |
| Minter City | 5897 | 37 | 32 | 8.55 |
| Monticello | 5987 | 44 | 43 | 10.75 |
| Moorhead | 6009 | 52 | 43 | 8.70 |
| Natchez | 6177 | 62 | 60 | 10.51 |
| Onward | 6562 | 37 | 35 | 7.37 |
| Pascagoula | 6718 | 44 | 40 | 8.86 |
| Picayune | 6921 | 44 | 42 | 9.36 |
| Pickens | 6926 | 43 | 42 | 8.23 |
| Pontotoc | 7111 | 39 | 37 | 9.45 |
| Poplarville | 7128 | 62 | 60 | 10.52 |
| Port Gibson | 7132 | 62 | 60 | 9.73 |
| Richton | 7444 | 34 | 32 | 9.64 |
| Rolling Fork | 7560 | 44 | 42 | 6.78 |
| State University | 8374 | 62 | 60 | 8.05 |
| Stoneville | 8445 | 72 | 69 | 8.21 |
| Tibbee | 8792 | 36 | 33 | 7.78 |
| Tupelo | 9003 | 30 | 27 | 5.62 |
| Tylertown | 9048 | 44 | 42 | 8.91 |
| University | 9079 | 62 | 60 | 8.29 |
| Van Fleet | 9159 | 44 | 41 | 8.22 |
| Water Valley | 9400 | 44 | 42 | 6.15 |
| Woodville | 9793 | 44 | 41 | 8.88 |
| Yazoo City | 9860 | 32 | 31 | 6.35 |
After testing for homogeneity, the performance of four commonly used probability distributions (Gumbel, Three Parameter Log Normal, Log Pearson Type III, and Wakeby) was evaluated. This procedure determined the best "fit" distribution to data at sites across the state (Bobee and Robitaille, 1976; Naghavi et al., 1991). The twelve sites with at least 60 years of record were used in this phase of the study. If no single distribution clearly provided the best fit, an alternative distribution based upon the Huff-Angel method (Huff and Angel, 1992) was used to determine the final storm quartiles.
Once the storm quartiles were derived, the data were adjusted in two ways. First, since discrete daily data were used, the storm estimates were adjusted to 24-hour moving-window equivalents. This was accomplished using a correction coefficient of 1.13 which was found to be applicable throughout the South Central United States and was also used in TP40 and the recent Midwest extreme rainfall atlas (Huff and Angel, 1992). To estimate storms of 3-hour duration, the 24-hour magnitudes were multiplied by a 0.62 coefficient, which was found to be applicable to sites across the region. After these final adjustments were made, storm magnitudes by duration and recurrence interval were mapped.
RESULTS AND DISCUSSION
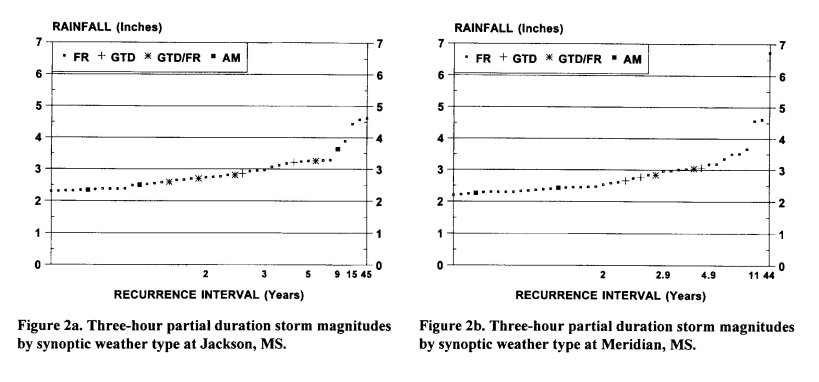
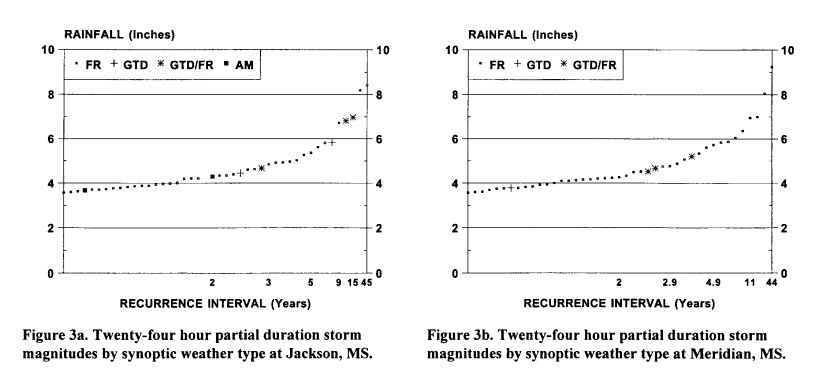
These storm series were tested for mixed distributions. Each storm in the 24-hour and 3-hour partial duration series at Jackson (44 years) and Meridian (43 years) were classified by synoptic storm type. The classes were Frontal (FR), Gulf Tropical Disturbance (GTD), combination Frontal and Gulf Tropical Disturbance (GTD/FR), and Air Mass (AM). The types were determined using surface and upper air weather charts in combination with observed surface data from these two locations.
Figures 2a/b and 3a/b show the 24-hour and 3-hour storms by synoptic weather type and magnitude at Jackson and Meridian respectively. The recurrence interval used in these displays are based on the Weibull plotting formula where RI=N+1/RANK where RI equals recurrence interval, N equals the number of years of record, and RANK is the rank of the storm in descending order of magnitude.
Frontal storms dominate both durations at both sites. There are some subtle differences between Jackson and Meridian especially at the upper part of the distribution where at Jackson more of a tropical influence is evident, especially for the 24-hour storms. The upper tail of the Meridian distributions is clearly more dominated by frontal.
The Kruskal-Wallis one-way non-parametric analysis of variance was used to determine whether or not these series were homogenous. As anticipated from viewing the figures, Jackson at the 24-hour duration comes closest to a significant result because of the strong presence of tropical events at the upper tail (Table 2). However, given the insignificant results, it is concluded that data for both durations at both sites contain no mixed distributions and therefore any subsequent statistical testing is valid. Similar results were found at nearby sites in Baton Rouge and New Orleans, LA (Faiers et al., 1994b).
| Table 2. Results of the Kruskall-Wallis test for mixed distributions. | ||||
| LOCATIO | DURATIO | K-W | F- | PROB. |
| JACKSON | 24 HOUR | 5.43 | 1.93 | 0.14 |
| JACKSON | 3 HOUR | 1.12 | 0.36 | 0.78 |
| MERIDIAN | 24 HOUR | 2.10 | 1.05 | 0.36 |
| MERIDIAN | 3 HOUR | 3.55 | 1.20 | 0.32 |
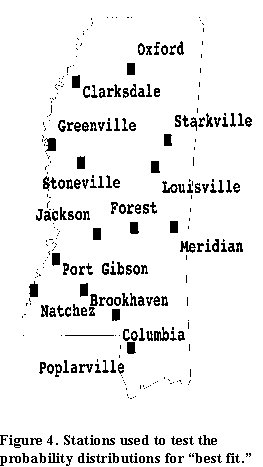
Assuming that these two sites represent the state in terms of homogeneity, the state precipitation data can then be fit to the different probability distributions to determine whether one distribution should be applied to all sites. The twelve sites with 60 or more years of record were used to evaluate these distributions (Fig. 4). The testing procedure, as outlined in Bobee and Robitaille (1976) incorporates the following:
(l) determining the Weibull plotting position for each storm at each of the 47 sites.
(2) fitting each partial duration series.
(3) interpolating the 2-, 5-, 10-, 20-, and 50-year storms from the Weibull plots.
(4) performing a linear regression between the interpolated Weibull plots and each of the estimates from the four distributions.
(5) ranking each distribution at each site based on the lowest mean square error between the probability estimates and the Weibull plots.
Ranks of each distribution at each site are displayed in Table 3 (where
a rank of 1=best fit). The Gumbel distribution (used in TP40) is clearly
the least successful in fitting the data. However, the Log Pearson Type
III and Wakeby are relatively close in terms of "best fit." Even those
two, however, provided the worst fit at two sites each, while Gumbel estimates
were closest at Clarkedale. Given these results, there was no clear justification
for the use of any one probability distribution over the others. This conclusion
is in general agreement with findings in other states in the South Central
U.S. as conducted by the Southern Regional Climate Center (Faiers et al.,
1997)
| Table 3. Rankings of mean square error for the four probability distributions (where a rank of 1=best fit). | ||||
| LOCATION | GMBL | PLOG | LOGP | WKBY |
| BROOKHAVEN | 2 | 3 | 4 | 1 |
| CLARKSDALE | 1 | 4 | 3 | 2 |
| COLUMBIA | 4 | 3 | 2 | 1 |
| FOREST | 4 | 3 | 1 | 2 |
| REENVILLE | 4 | 3 | 2 | 1 |
| LOUISVILLE | 4 | 3 | 1 | 2 |
| NATCHEZ | 3 | 2 | 1 | 4 |
| POPLARVILLE | 4 | 3 | 2 | 1 |
| PORT GIBSON | 2 | 1 | 3 | 4 |
| STATE UNIVERSITY | 4 | 3 | 1 | 2 |
| STONEVILLE | 4 | 3 | 2 | 1 |
| UNIVERSITY | 3 | 2 | 4 | 1 |
| SUM | 39 | 33 | 26 | 22 |
In the South Central U. S., this method was found to produce 50-year and 100-year estimates which were too excessive, so a modified version of this technique was examined. In this method referred to here as the SRCC method, only the recurrence intervals were logged and the regression was carried out between the logged recurrence intervals and the linear rainfall amounts. Regionally, these results have proven to be quite reliable and this technique was then applied to the Mississippi data.
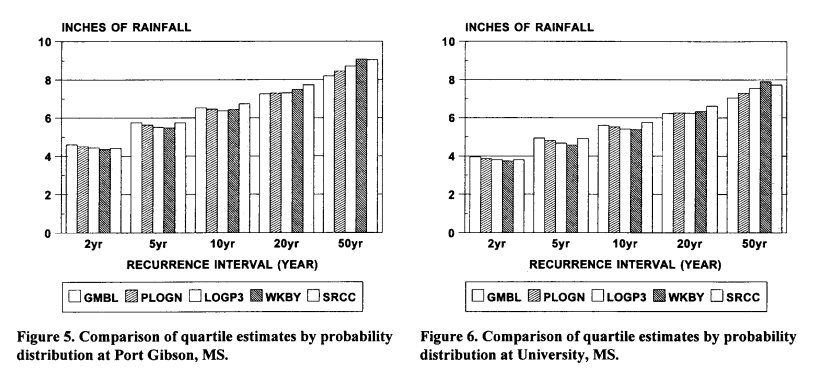
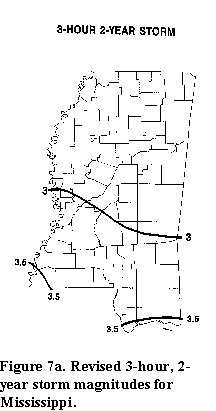
Figures 5 and 6 display the quartile estimates
using the four probability distributions and the SRCC method at Port Gibson
and University (Oxford). In both instances, the SRCC results are not dissimilar
to the other quartiles and more closely resemble the Wakeby quartiles,
which had the best state-wide ranking of the four distributions.
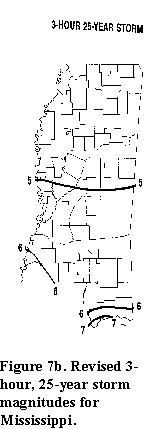
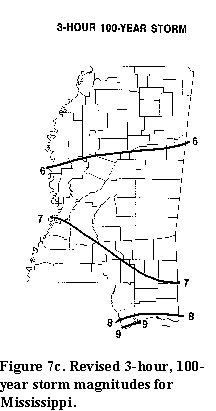
When the quartiles are plotted by duration and recurrence interval,
the geographic pattern of extreme rainfall across the state is revealed.
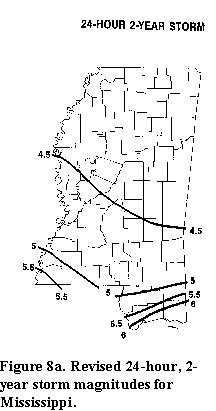
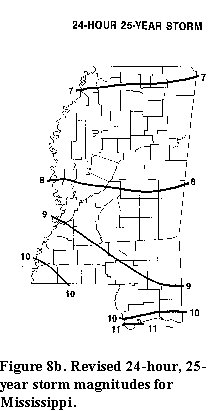
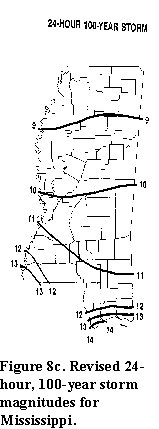
Figures 7a, b, c
and 8a, b, c
display the patterns for the 2-, 25-, and 100-year storms at the 3-hour
and 24-hour duration, respectively. There tends to be a strong gradient
towards the coast for both durations with magnitudes rapidly increasing
towards the Gulf of Mexico. Across the central and northern parts of the
state, there is a tendency towards a more slight decrease in storm magnitudes.
When compared to the original TP40, the 3-hour duration storms show large differences in some areas. For example, the 2-year storm pattern is very similar near the coastline, but the central and northern portions of the state show values about a half inch higher. The 24-year storm pattern shows nearly 7 inches along the extreme coast, while TP40 values are about 5.5 inches. In northern Mississippi, results show storm magnitudes of between 4 and 5 inches, while TP40 displays values between 3.75 and 4 inches. Results are even more disproportionate at the 100-year storm interval where the current analysis indicates storm magnitudes as being 2 inches greater than TP40 along the Gulf Coast, and a half inch to an inch greater in northern Mississippi. At the 24-hour duration, 2-year storm patterns are very similar with a steep gradient in the coastal zone that becomes more gradual in central and northern Mississippi. Results are also similar for the 25-year storm values, with the exception of the extreme north where the revised values are over a half inch larger than depicted in TP40. Finally, the 100-year storm values are also similar, but the update shows an even steeper gradient in the coastal zone and values almost an inch higher in the north.
CONCLUSION
By using the contemporary techniques employed in this study (in particular the SRCC method for deriving quartile estimates), a more detailed and realistic pattern of storm magnitudes are determined for the state of Mississippi. The longer period of record and a more dense network of stations contributed greatly to the improvement over previous studies.
The updated maps indicate that the greatest storm magnitudes are found
along the Gulf Coast with the lowest magnitudes depicted along the Tennessee
border. In general, the storm magnitudes increase slowly towards the south,
with a strong gradient towards the coast. Across the state, storm magnitudes
are generally higher than estimated in TP40. At some locations in the extreme
southern part of the state, storm magnitudes are more than two inches greater
than previously estimated. Such findings should be of value to a wide range
of water resource users and planners. These results are being incorporated
into a regional atlas of extreme rainfall frequencies and magnitudes across
the South Central United States (Faiers et al., 1997).
ACKNOWLEDGMENTS
The authors would like to thank Robert V. Rohli (Kent State University), Robert A. Muller (Louisiana State University) and John M. Grymes, III (Louisiana State Climatologist) for their assistance with this project. The work was partially funded by NOAA grant No. NA908A-D-CP775.
LITERATURE CITED
Bobee, B., and R. Robitaille. 1976. The Use of Pearson Type 3 and Log Pearson Type 3 Distributions Revisited. Water Resources Research 13 (2):427443.
Dunne, T., and L.B. Leopold. 1978. Water in Environmental Planning. W.H. Freeman and Company, San Francisco.
Faiers, G.E., B.D. Keim, and R.A. Muller. 1997. Rainfall Frequency-Magnitude Atlas for the South Central United States. SRCC Technical Report 97-1, Geoscience Publications, Baton Rouge, LA. 40 pp.
Faiers, G.E., J.M. Grymes III, B.D. Keim, and R.A. Muller. 1994a. A Reexamination of Extreme 24-Hour Rainfall in Louisiana, USA. Climate Research 4:2531.
Faiers, G.E., B.D. Keim, and K.K. Hirschboeck. 1994b. A Synoptic Evaluation of Frequencies and Intensities of Extreme Three- and 24-Hour Rainfall in Louisiana. Professional Geographer 46 (2):156163.
Hershfield, D.M. 1961. Rainfall Frequency Atlas of the United States for Durations from 30 Minutes to 24 Hours and Return Periods from 1 to 100 Years. Technical Paper No. 40. National Weather Bureau, Washington, D.C. 115 pp.
Hirschboeck, K.K. 1987. Hydroclimatically-Defined Mixed Distributions in Partial Duration Flood Series. Pages 199212 in V.P. Singh, ed. Hydrologic Frequency Modeling. D. Reidel Publishing Co., Dortrecht, Holland.
Huff, F.A., and J. Angel. 1992. Rainfall Frequency Atlas of the Midwest. Illinois Water Survey, Champaign, IL. 141 pp.
Keim, B.D. 1997. Preliminary Analysis of the Temporal Patterns of Heavy Rainfall Across the Southeastern United States. Professional Geographer 49 (1):94104.
Keim, B.D. 1996. Spatial, Synoptic, and Seasonal Patterns of Heavy Rainfall in the Southeastern United States. Physical Geography 17 (4):313328.
Keim, B.D. and R.A. Muller. 1992. Temporal Fluctuations of Heavy Rainfall Magnitudes in New Orleans, LA: 18711991. Water Resources Bulletin 28:72130.
McWhorter, J.C., R.K. Matthes, and B.P. Brooks, Jr. 1966. Precipitation Probabilities for Mississippi. Water Resources Research Institute, Mississippi State University, Mississippi State, MS.
Muller, R.A. 1977. A Synoptic Climatology for Environmental Baseline Analysis: New Orleans. Journal of Climate and Applied Meteorology 16:293301.
Naghavi, B., V.P. Singh, and F.X. Yu. 1991. LADOTD 24-Hour Rainfall Frequency Maps and I-D-F Curves. Louisiana Transportation Research Center, Baton Rouge, LA. 28 pp.
Wax, C.L., and J.C. Walker. 1986. Climatological Patterns and Probabilities of Weekly Precipitation in Mississippi. Mississippi Agricultural and Forestry Experiment Station, Information Bulletin 79. Mississippi State, MS. 150 pp.