Anthony J. Vega
Department of Anthropology, Geography and Earth Science, Clarion University,
Clarion, PA 16214
This study investigates the link between pressure variations in the southwestern North Atlantic and annual variations in southern United States seasonal precipitation. Typically, climatological studies greatly ignore the importance of downstream pressure variations on upstream surface phenomena. The underlying hypothesis of this study, therefore, is that downstream pressure variations are important to upstream precipitation processes. Rotated principal components (RPCA) of seasonal sea-level pressure variations in the southwestern North Atlantic are related to seasonally derived precipitation regions for the southern United States. The derived RPCA scores are correlated to regional precipitation anomalies for each season to determine impacts of downstream atmospheric variations on the regional precipitation regimes. Results indicate the importance of North Atlantic sea level pressure variations on southern US precipitation. Of primary importance are relationships found during the autumn season as North Atlantic pressure variations contribute significantly to long-term regional climate change found in three of the five derived precipitation regions. The analysis suggests a return of atmospheric mass to the southwestern North Atlantic and Gulf of Mexico regions during recent decades as hypothesized by Davis et al. (1997). Such phenomena may be responsible for the extreme positive precipitation anomalies found over the central and western regions of the southern US during recent times. Such an increase in atmospheric mass over these regions contributes to a stronger North Atlantic Subtropical High resulting in greater moisture advection into the central and western regions. Simultaneously, eastern regions experience more frequent drought episodes through greater atmospheric subsidence.
Understanding climate variability is important because short duration, seasonal to annual, extreme climate variations have greater economic and environmental impacts than slow, decadal to century, climate change (Hare, 1985). Regional studies of climate are therefore essential to properly understand the global climate system and the resulting impacts of a changing global climate. The complexity of regional (defined as the smallest area retaining homogeneous climate properties) precipitation processes and the associated variability of precipitation are particularly challenging. This is especially true with regard to the southern United States as the proximity of the region to large water bodies, mountains, and the arid climate of the desert southwest, make synoptic evaluations and extended General Circulation Model forecasts exceedingly difficult (Brazel, 1991).
The Gulf of Mexico is the primary source of water vapor for the southern US (Weiss, 1992) and the periodic horizontal transport of Gulf moisture greatly contributes to the precipitation regimes of the Gulf South during all seasons (Weiss, 1992). The advective process may be particularly enhanced when the North Atlantic Subtropical High (STH) is strengthened and/or displaced to the west, thereby inducing strong southerly flow through the Gulf of Mexico and into the southern US (Henderson and Vega, 1996). As a result, precipitation within the Gulf Coast region, whether convectively forced or dynamically induced, may be enhanced with strengthened southerly flow which contributes to greater low-level instability (Hsu, 1992). This enhancement of regional dynamics may be present during every season in this region (Henderson and Vega, 1996).
This analysis addresses the relationship between southwestern North Atlantic circulation and seasonal southern US regional precipitation variability as a previous study (Vega et al., 1998) identified relationships between Gulf of Mexico pressure variations and southern US regional precipitation variations. The analysis seeks to understand the relationship between downstream atmospheric flow variations over the southwestern North Atlantic and upstream precipitation variability in the Gulf South of the United States. Detailing of these relationships is important as downstream pressure variations are typically ignored in most climatological studies (Stahle and Cleveland, 1992; Henderson and Vega, 1996). It is hypothesized that downstream variations are important to regional precipitation regimes, at least in the southern US. Relationships in the magnitude of precipitation may stem directly from moisture advection set up through downstream pressure variations (Henderson and Robinson, 1994). Thus, low-level moisture transport may greatly affect the amount and duration of localized/regional precipitation forcing which could be manifest in long term precipitation records.
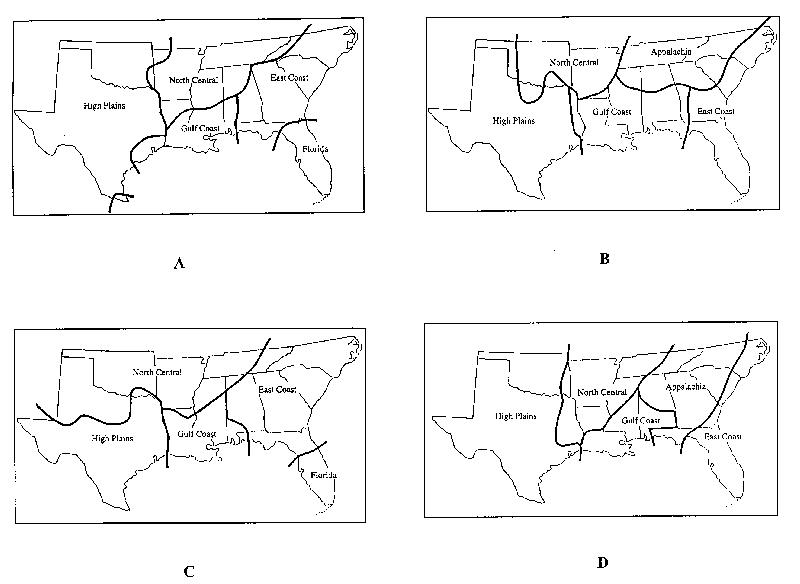
Overview of Gulf Coast Precipitation--This study focuses on seasonal precipitation for an eleven state area of the southern United States. For this analysis, seasonal precipitation regions (Figure 1) are used as defined by Henderson and Vega (1996). The regions were derived using a rotated eigenvector analysis of seasonal US climate division data for the time period 1946-1988. Henderson and Vega (1996) calculated seasonal precipitation anomalies for each derived region by averaging the actual precipitation anomalies of each climate division included within each region. The anomalies were examined for long-term changes as well as shifts in variability through time. Statistically significant (0.05 alpha level) increases in variability through time were detected in two precipitation regions for the winter season (Gulf Coast, East Coast) (Figure 1A). Three regions showed variation changes during spring (High Plains, Gulf Coast, North Central) (Figure 1B). Of these, the Gulf Coast and the North Central regions recorded significant increases in variability while the High Plains region recorded a significant decrease. All regions proved to be temporally stable during the summer season (Figure 1C), while during autumn, the East Coast region (Figure 1D) recorded a significant decrease in variability through the study period.
Long-term climate change, as defined as a statistically significant (0.05 alpha) change in slope, was detected only for the autumn season. The High Plains and the North Central regions showed a significantly increasing precipitation anomaly trend through the study period while the East Coast region recorded a significantly decreasing trend.
Henderson and Vega (1996) partially explained the precipitation variability fluxes and autumnal slope changes through an examination of mean monthly atmospheric teleconnection indices (Pacific North American, Southern Oscillation and North Atlantic Oscillation) which describe geographically fixed pressure fluctuation centers, plus a derived regional flow index (Bermuda High). The results indicated that the Bermuda High Index (BHI) was correlated most strongly with regional precipitation variability. This was especially true during the critical autumn season where the BHI was the only index to correlate with any of the precipitation regions. The BHI and PNA index correlations allowed inferences to be made as to the importance of the downstream southwestern North Atlantic pressure fluctuations on precipitation variability throughout the upstream study region (Henderson and Vega, 1996).
This analysis attempts to provide more detail to the examination of the influence of North Atlantic circulation variations on southern US precipitation. Therefore, the underlying goal is to further define relationships between downstream sea-level pressure (SLP) variations and upstream regional precipitation fluctuations.
Literature Review--Because this analysis is concerned with the role of downstream pressure variations, more specifically, North Atlantic basin pressure variations, a proper review of the North Atlantic subtropical high (STH) is prudent. Sahsamanoglou (1990) indicates that the North Atlantic subtropical anticyclone, or Bermuda/Azores High, has undergone a series of intensity changes between 1873 and 1980. Lower than average pressures dominated the early record; central pressures increased in excess of the overall mean between 1903 and 1930; while reduced pressures dominated between 19311967. After this, central pressures rose above the long-term mean. Pressure fluctuations in the Subtropical High (STH) greatly affect generalized flow over the North Atlantic basin. Weaker central pressure allows the meridional component to dominate while higher pressures induce stronger, low-level zonal flow (Sahsamanoglou, 1990).
Although important, the intensity of the high is only one variable which may contribute to precipitation variability in the southern US; the central position of the pressure system is also important. During particular times, the precipitation variability of the region may be caused more by the position of the STH center than intensity (Stahle and Cleaveland, 1992). This may be especially true during summer months, when central STH pressures remain relatively stable.
Davis et al. (1997), indicate that the STH displays rather abrupt position shifts and intensity fluctuations. The annual climatology derived by Davis et al. (1997), generally agrees with Sahsamanoglou (1990) in that the STH gradually intensifies from March, when the center is located in its most southwestward position, to May, when rapid expansion, strengthening, and northward migration occur. The trend continues through July, at which time the STH encompasses most of the North Atlantic basin and the center is located in its most north westward location. August signals weakening and contraction of the pressure system and September signals the onset of a secondary pressure maxima located over the southeastern US. This node intensifies and migrates south through the autumn and winter seasons while the North Atlantic center weakens and shifts eastward. During November, the oceanic center moves eastward to a position south of the Azores Islands and by January the maximum eastward position, 30oN, 20oW, is attained. During December and January the STH strengthens as a result of the high frequency of migratory polar anticyclones which stall over the North Atlantic thus contributing atmospheric mass to the region (Bluestein, 1993). These polar anticyclones predominantly follow either a southeastward track through the Mid-Atlantic states, or a southward track over the southern US (Klien, 1957; Dallavalle and Bosart, 1975; Ziska and Smith, 1980; Rohli and Rogers, 1993; Davis et al., 1997).
With regard to long-term STH trends, meridional flow across the North Atlantic basin was more frequent during the latter half of the century (Kalnicky, 1974; Makrogiannis et al., 1982; Rogers, 1984; Sahsamanoglou, 1990). Additionally, blocking, a stagnation of small-scale circulation features, related to STH strengthening was less prevalent over the Atlantic and Great Britain during the last half century (Lamb, 1968; Briffa et al., 1990). This decrease in blocking coincides with a net increase in blocking episodes over western Europe. Finally, both the frequency and intensity of the STH has significantly declined over this century (Davis et al., 1997). This reduction is valid for both the winter and summer seasons and signals the net removal of atmospheric mass from the North Atlantic basin. However, a slight intensity resurgence is noted during the warm decade of the 1980s (Davis et al., 1997) suggesting that fluctuations in the STH are driven, at least in part, by hemispheric temperatures.
Relationships Between Downstream Pressure and Upstream Precipitation--Advective processes are typically ignored when considering long-term precipitation variability (Stahle and Cleveland, 1992; Henderson and Vega, 1996). The Gulf of Mexico is the primary source of water vapor throughout much of North America and advected moisture from this area and the southwestern North Atlantic helps provide favorable conditions for precipitation from New Mexico to Canada and all points east (Weiss, 1992). This addition of moisture is highly related to the intensity and position of the STH (Henderson and Vega, 1996) resulting in conditions that not only favor the frequency of southern US precipitation forcing but also leads to increased precipitation magnitudes (Keim, 1997).
Regional studies indicate that precipitation anomalies during the spring season along the Atlantic seaboard are related to the strength and position of the STH (Stahle and Cleaveland, 1992; Henderson and Vega, 1996; Keim, 1997). When the western flank of the STH expands (contracts) westward (eastward) from its mean position, a drier (wetter) than normal spring season results. Wang and Li (1990) show a similar relationship between precipitation trends in China and the east-Asian monsoon. There, the strength and position of the Western Pacific Subtropical High determines, to a great degree, the amount of precipitation in the semi-arid region of northern China.
General considerations of the relationship between the STH and precipitation variability for the North American continent are not fully explored. Although Stahle and Cleaveland (1992) provide the framework for an in-depth examination of the STH, they do not fully define the relationships between the STH and the widespread precipitation variability which occurs throughout the southern US. Easterling (1991) examined thunderstorm activity across the southeastern US and inferred that the STH dominates summer convective processes. The influence of the STH either enhances thunderstorm activity through greater moisture advection and instability west of the area of highest pressures or suppresses activity through subsidence in the area of greatest pressures. Given this, downstream pressure variations and their affects on upstream precipitation are at least somewhat important and should be more fully investigated.
Data--Surface pressure data (1013 millibarmb) was
obtained from the National Meteorological Center Grid Point Data Set: Version
II (NCAR, 1990). This data set includes geopotential heights (heights of
constant pressure surfaces) across an equidistant octagonal grid over the
Northern Hemisphere. The data are based on twice daily (00 and 12 UTC)
observations for 1,977 grids points centered on the North Pole. Monthly-mean
grids, constructed from the twice daily observations, are used throughout
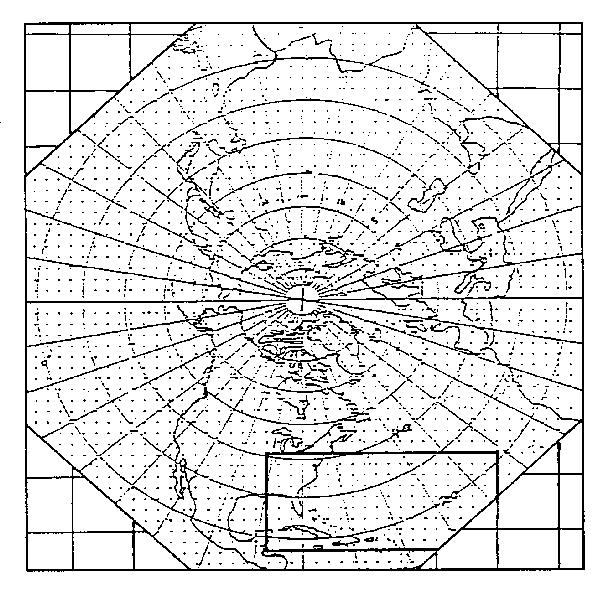
the analysis. The grid domain chosen for this analysis is shown in Figure
2. The domain was selected so that pressure variations associated with
the North Atlantic STH could be captured. It is recognized that the small
grid domain in conjunction with the eigenvector analysis described below
could simply maximize variance in various portions of the grid domain.
For the goals of this study, this is desirable as the study seeks to understand
how small spatial scale downstream pressure variations could affect upstream
southern US precipitation. The surface pressures were extracted for the
grid domain for the study period 19461988. Southern regional precipitation
anomalies for each season, as calculated by Henderson and Vega (1996),
are used for the same temporal period. The anomalies were calculated by
grouping and averaging all related (as defined in a rotated principal components
analysis using a 0.5 eigenvector isoline) climate divisions for each season.
MATERIALS AND METHODS
This study seeks to understand relationships between variations in SLP and regional precipitation anomalies on a seasonal basis. Therefore, the mean monthly surface data was grouped into standard meteorological seasons (winter=DJF) and standardized (mean=0; std=1) seasonally. Varimax rotated (S-Mode) principal components analysis (RPCA) was used to determine the major seasonal modes of surface pressure variability for the chosen grid domain. Use of eigenvector techniques to establish relationships between surface pressure anomalies and regional phenomena are well established (Leathers et al., 1991; Rohli and Rogers, 1993). The varimax rotation technique is chosen for this analysis due to the fact that the unrotated eigenvector solutions produced a classic Buell sequence (Buell, 1975) of domain shape dependence. The orthogonally rotated solutions are therefore more indicative of 'real world' pressure variations (Dunteman, 1989), and therefore more appropriate (Yarnal, 1993; Vega and Henderson, 1996). It must be noted that the varimax rotation technique in eigenvector analysis forces all related data to either load highly upon a given component or not at all through the eigenvector transformation process (Dunteman, 1989). Therefore, loadings (spatial covariation of eigenvectors) isolines presented in the figures are all positive for the retained components. This is merely a function of the technique which typically eliminates negative values for the first few components. The number of components containing exclusively, or almost exclusively, all positive values is a function of the number of components retained and the size of the data set incorporated. Through this methodology, the precise geographical location of greatest variability is determined. Unrotated eigenvectors typically produce dual or multiple 'action centers' of inverse sign, again a function of the mathematics employed. Therefore, unrotated loadings usually contain as many negative values as positive in the first primary components (Vega and Henderson, 1996). Since this analysis is concerned with identifying the exact locations of STH variability and the elimination of domain shape dependence in the derived component loadings patterns, rotation techniques are justified (Vega and Henderson, 1996).
Pearson correlations (r) were used to determine relationships between
the derived PCA scores (time-series; eigenvalues) and the regional precipitation
anomalies. Significant correlations imply physical relationships between
the pressure variations and precipitation forcing mechanisms over the correlated
areas.
Table 1. Individual Surface Pressure (1013 mb) Principal Component Explained Variance (in %) for the Winter through Autumn Seasons.
| PC1 | PC2 | PC3 | PC4 | PC5 | PC6 | |
| Winter | 25.72 | 18.95 | 18.92 | 16.45 | 11.78 | 8.17 |
| Spring | 22.23 | 21.42 | 18.87 | 16.68 | 15.69 | |
| Summer | 29.26 | 18.15 | 16.02 | 12.74 | 11.87 | 9.28 |
| Autumn | 26.89 | 19.91 | 14.15 | 13.85 | 11.41 | 8.33 |
RESULTS
Retention of principal components for rotation was determined through a combination of the Kaiser-Guttman eigenvalue 1 criterion (Kaiser, 1958) and a scree plot analysis (Cattell, 1966). Through this, it was determined that a total of 6 principal components be retained for the winter, summer and autumn seasons, and 5 for spring. The components explain 92.3% of the total variance for winter, 88.9% for spring, 89.4% for summer, and 85.0% for autumn. The amount of variance explained by each individual principal component is shown in Table 1. The high degree of spatial autocorrelation present in the gridded data set accounts for the high percentages of explained variance.
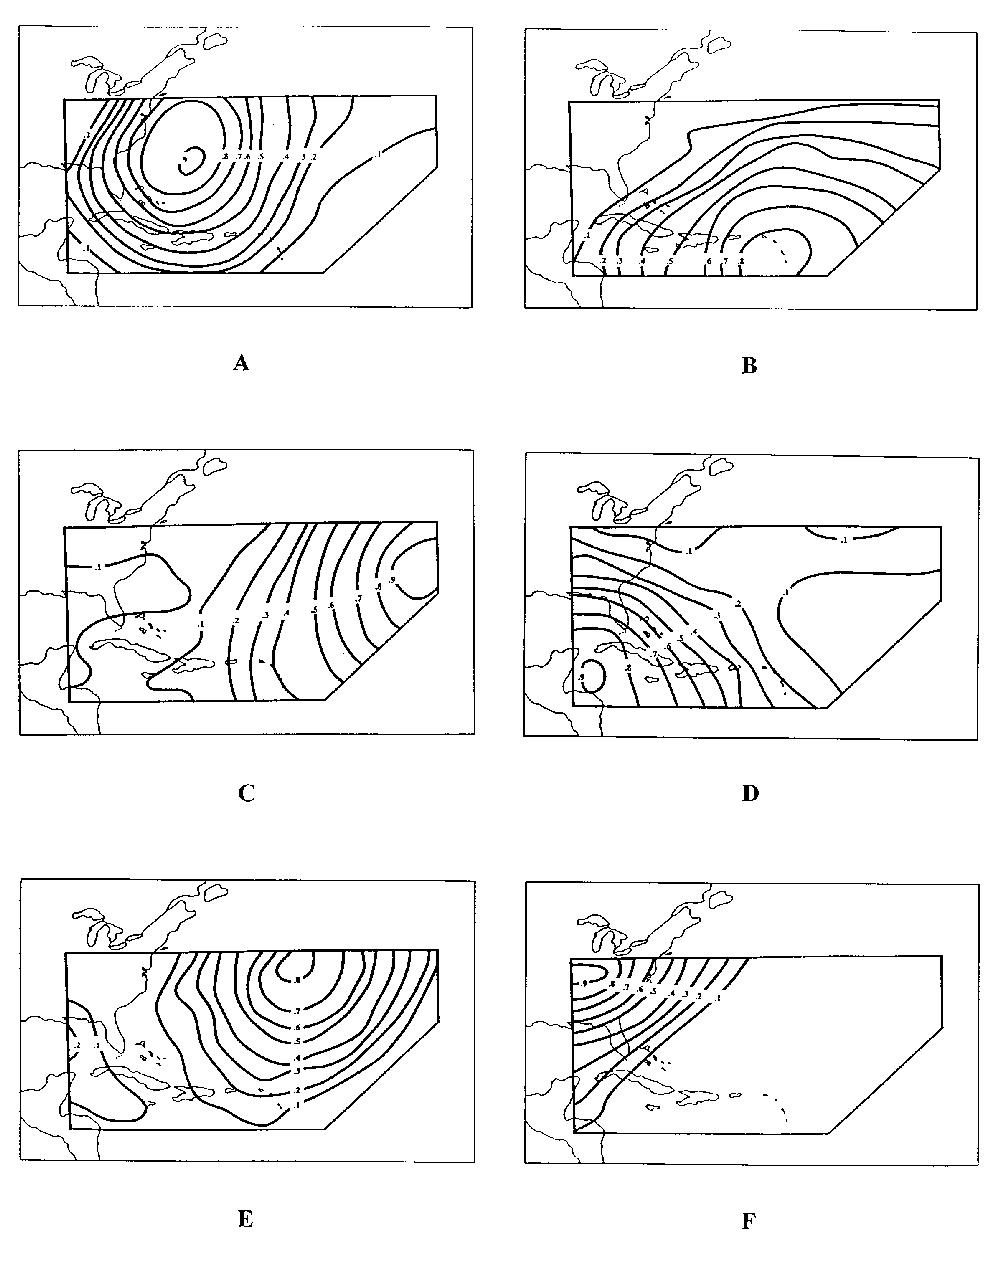
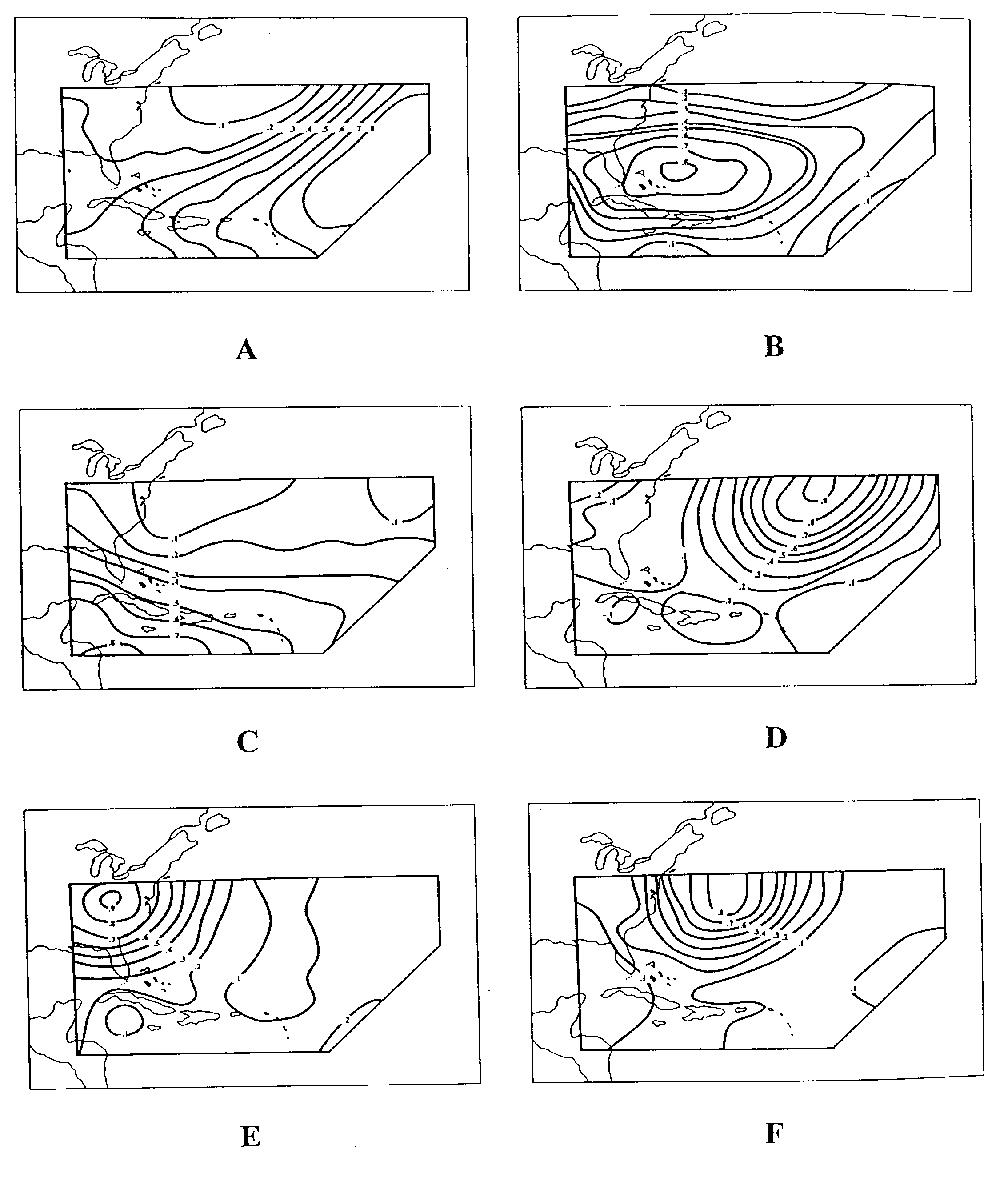
Winter--The principal components loadings maps of the 6 rotated components for winter are presented in Figure 3. Although the sign of the PC loadings is arbitrary, negative loadings are relatively few in this analysis due to the varimax rotation procedure. Also, the loadings maps do not represent closed atmospheric systems per se (cyclones and anticyclones). The patterns represent the areas of greatest pressure variability, with the highest loading region (action center) representing the area of greatest temporal and spatial pressure fluctuations. Correlations between the principal components scores and the regional precipitation anomalies for winter are presented in Table 2.
Principal component 1 (Figure 3A) shows an action center located over the North Atlantic Ocean just east of the US coastline. The component correlates significantly (alpha=0.05) with the Florida and North Central regions (Table 2) explaining 37.2% of the variability (r2) in North Central precipitation and 13.1% of that for Florida. The correlation coefficients are negative with respect to Florida and positive with respect to the North Central region. Therefore, during the positive (negative) component phase, negative (positive) precipitation anomalies are recorded in the Florida region while positive (negative) precipitation anomalies occur in the North Central region.
The loadings pattern for winter PC2 depicts an action center located over the southeastern portion of the grid domain (Figure 3B). The PC scores are significantly correlated to the East Coast precipitation region explaining 12.8% of the regions precipitation variability. When the pattern is in its positive (negative) mode, positive (negative) precipitation anomalies are recorded in the region.
The third PC shows an action center located over the extreme eastern portion of the grid domain (Figure 3C). The PC scores are significantly correlated with precipitation in the High Plains region, explaining 9.3% of the precipitation variability. The correlation suggests that rising (lowering) pressures in the action center are related to positive (negative) precipitation anomalies in the High Plains region.
Principal component 4 depicts an action center located over the central Gulf of Mexico and the Caribbean Sea (Figure 3D). This Gulf of Mexico ridging (troughing) pattern is most important during winter as it relates significantly to three of the five precipitation regions; the East Coast, Gulf Coast, and Florida. All significant correlations are negative indicting that the positive (negative) component mode is associated with negative (positive) precipitation anomalies in the regions.
The fifth principal component loads highly with grid points in the north-central section of the domain (Figure 3E). Variations in the action center correlate well with the High Plains region explaining 25.4% of the regions winter precipitation variability. The correlation is negative indicating an out-of-phase relationship with the components.
Principal component 6 shows a center of variation over the mid-western
US (Figure 3F). This pattern is significantly correlated
to the variability present in the East Coast region as well as the High
Plains. The East Coast correlation is negative while the High Plains correlation
is positive. This suggests that higher (lower) pressures in the mid-western
US relate to precipitation reductions (increases) in the East Coast region
and precipitation increases (decreases) in the High Plains.
Table 2. All Winter Season Significant (alpha=0.05) Correlations between Southern US Regional Precipitation and Surface Pressure Principal Components.
| EC | FL | GC | HP | NC | |
| r
P > |R| |
PC2
0.358 0.016 |
PC1
-0.361 0.015 |
PC4
-00.531 0.000 |
PC3
0.305 0.043 |
PC1
0.610 0.000 |
| r
P > |R| |
PC4
-0.456 0.001 |
PC4
-0.641 0.000 |
| PC5
-0.504 0.000 |
|
| r
P > |R| |
PC6
-0.313 0.038 |
| | PC6
0.308 0.041 |
|
EC=East Coast, FL=Florida, GC=Gulf Coast, HP=High Plains, NC=North Central.
Table 3. All Spring Season Significant (alpha=0.05) Correlations between Southern US Regional Precipitation and Surface Pressure Principal Components.
| AP | EC | GC | HP | NC | |
| r
P > |R| |
PC3
-0.421 0.004 |
PC3
-0.645 0.000 |
PC3
-0.543 0.000 |
PC3
-0.312 0.041 |
PC3
-00.339 0.026 |
AP=Appalachia, EC=East Coast, GC=Gulf Coast, HP=High Plains, NC=North
Central.
Spring--Loadings maps for the spring season rotated components are shown in Figure 4. Table 3 depicts temporal correlations between the PCs and the precipitation regions. The first two components as well as PC4 (Figures 4A, B, and D, respectively) do not significantly relate to any of the precipitation regions. Principal component 3 (Figure 4C), however, is the most important pattern with regard to precipitation as all five regions significantly correlate to the component scores. The variability center of the loadings pattern is located over the Gulf of Mexico and Caribbean Sea. Correlations with the regional precipitation anomalies are negative in all cases, implying that increased (decreased) pressures over the region are associated with negative (positive) regional precipitation anomalies. The greatest statistical association is with the East Coast (41.7% explained variance) while the lowest association is with the High Plains (9.8%). Therefore, the pressure pattern becomes decreasingly important inland across an east-west transect.
The loadings for PC5 depict an action center located off the eastern seaboard near the coast of North Carolina (Figure 4E). The component time-series is associated with only the High Plains region. The correlation is positive indicating an in-phase relationship between pressure variations off the eastern seaboard and precipitation in the region.
Summer--Loadings maps of the summer season rotated components are presented in Figure 5. Relationships between the circulation patterns and the regional precipitation anomalies are depicted in Table 4. The first and second summer season PCs (Figures 5A and 5B) depict loadings configurations which occupy the entire eastern and central sections of the grid domain, respectively. However, the patterns prove unimportant to regional precipitation variability.
Variations in the pressure field of PC3 occur mainly over the southwestern corner of the domain (Figure 5C). The low-latitude pattern relates significantly with the Gulf Coast precipitation region explaining 9.2% of the total variance. The correlation is positive indicating that when the action center is positive (negative), higher (lower) pressures dominate the southern Caribbean and Gulf of Mexico which is related to positive (negative) precipitation anomalies in the Gulf Coast region.
The fourth PC for summer (Figure 5D) is interesting in that it is similar to patterns seen in both seasons previously discussed. The action center is located in the northeast quadrant of the domain and is characterized by a tight loadings pattern. Both the High Plains and North Central precipitation regions correlate significantly to the circulation component, however, the correlations imply that the positive (negative) component mode reduces precipitation in the precipitation regions.
Summer component 5 (Figure 5E) is centered on
the Mid-west US and displays a tight loadings pattern which extends over
the eastern seaboard. The component is significantly related only to the
High Plains region where the positive correlation explains 9.2% of the
total summertime precipitation variability.
Table 4. All Summer Season Significant (alpha=0.05) Correlations between Southern US Regional Precipitation and Surface Pressure Principal Components.
| EC | FL | GC | HP | NC | |
| r
P > |R| |
PC6
0.634 0.000 |
PC6
0.357 0.018 |
PC3
0.302 0.048 |
PC4
-0.310 0.042 |
|
| r
P > |R| |
| | | PC5
0.303 0.048 |
|
EC=East Coast, FL=Florida, GC=Gulf Coast, HP=High Plains, NC=North Central.
Table 5. All Autumn Season Significant (alpha=0.05) Correlations between Southern US Regional Precipitation and Surface Pressure Principal Components.
| AP | EC | GC | HP | NC | |
| r
P > |R| |
PC2
0.314 0.040 |
PC4
-0.564 0.000 |
PC2
0.463 0.001 |
PC2
0.330 0.030 |
PC2
0.362 0.016 |
| r
P > |R| |
PC6
-0.480 0.001 |
| PC5
0.441 0.003 |
PC4
0.390 0.009 |
PC4
0.307 0.045 |
| r
P > |R| |
| | PC6
-0.301 0.049 |
| PC5
0.327 0.032 |
EC=East Coast, FL=Florida, GC=Gulf Coast, HP=High Plains, NC=North Central.
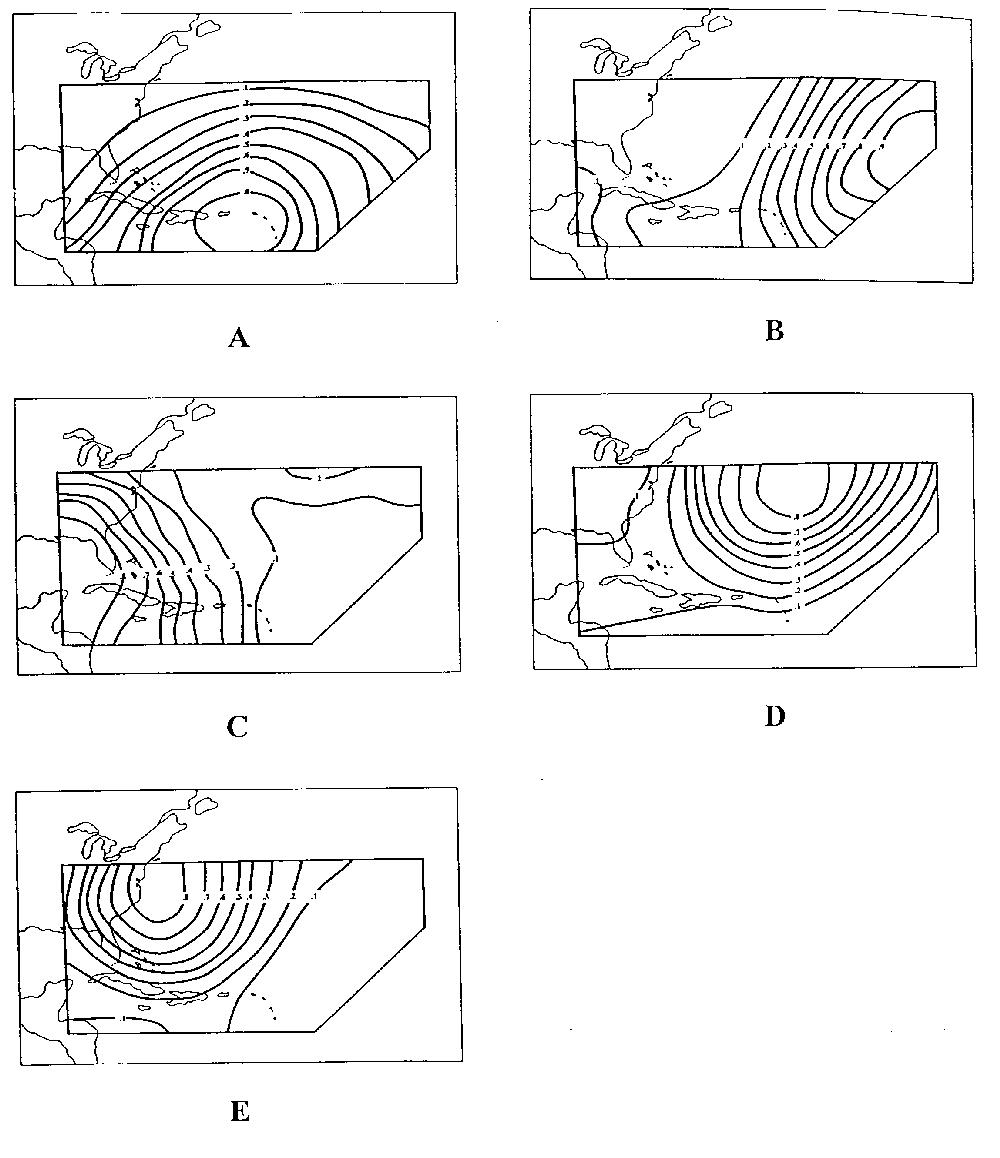
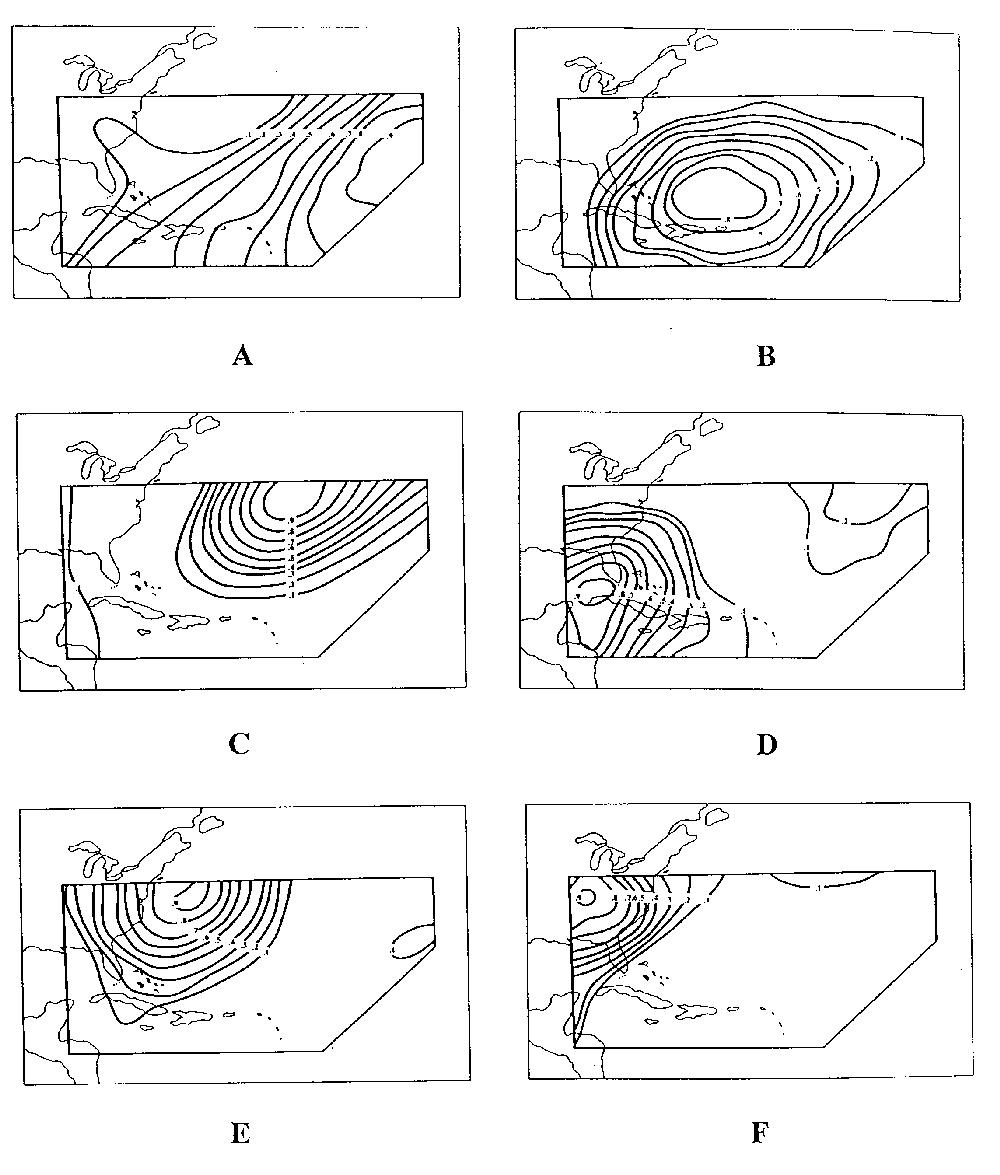
Autumn--Because circulation in autumn is closely related to that of summer, it is not surprising that similar loadings patterns exist between the retained components for each season. Loadings maps for the autumn season rotated components are shown in Figure 6. Statistical relationships between these components and the autumnal precipitation regions are presented in Table 5.
The entire eastern domain is reflective of pressure variations depicted in PC1 (Figure 6A). However, like PC3 (Figure 6C), the pattern does not correlate significantly with any of the precipitation regions. Autumn component 2 (Figure 6B) is similar to summer PC2 (Figure 5B) but unlike the summer pattern, this component correlates significantly with every region except the East Coast (Table 5). Further, all significant correlations are positive. Variations in the loadings pattern relate to widespread positive regional precipitation anomalies in the positive component mode and negative precipitation anomalies in the opposite component phase.
Three of the five autumnal precipitation regions correlate significantly with PC4 (Figure 6D). The pattern is similar to a pattern seen during every season, an action center located over the Gulf of Mexico which, in the positive component mode is similar to the Gulf High identified by Muller (1977), and explored temporally by Muller and Willis (1983). The pattern is statistically related to the East Coast (31.9% explained variance), High Plains (15.2%), and North Central (9.4%) regions. The correlations match the statistically significant long-term precipitation trends identified by Henderson and Vega (1996).
Autumn component 5 (Figure 6E) shows a pattern centered near the eastern seaboard. The pattern correlates significantly with the three interior precipitation regions; the Gulf Coast, North Central, and Appalachian regions. The relationships indicate that higher (lower) pressures off the eastern seaboard are associated with positive (negative) precipitation anomalies in the associated regions.
Again, a component loadings pattern (PC6) signifies pressure variations
over the mid-western US (Figure 6F). Both the Appalachian
and Gulf Coast regions correlate negatively with the pattern time-series
indicating that positive (negative) pressure anomalies in the variability
area relate to negative (positive) regional precipitation anomalies.
DISCUSSION
Five dominant principal component patterns emerge which transcend the seasonal analysis. The first is a pattern centered on the Gulf of Mexico (ex: Figure 6D). Correlations between the component scores and the precipitation anomalies indicate that rising heights/pressures in this region are related to decreases in regional precipitation. During the cool months, higher (lower) pressures are likely related to persistent longwave ridging (troughing) over the region and/or the migration of polar anticyclones (mid-latitude cyclones). During warm times, the pattern may reflect STH expansion which in the positive (negative) component mode, reduces (increases) eastern regional precipitation through subsidence and enhances (reduces) western regional precipitation through moisture advection. During autumn the pattern is related to the long-term precipitation changes noted in the East Coast, High Plains, and North Central precipitation regions identified by Henderson and Vega (1996). When the pattern is present in the positive (negative) component phase, persistent eastern seaboard blocking (troughing) is likely. This results in possible drought conditions along the East Coast while the western regions experience positive precipitation anomalies. Such was the case during the 1993 Upper-Mississippi River Basin flood (Kunkel et al., 1994). Evidence suggests that similar patterns, and the resulting surface responses, may become more frequent with increased hemispheric temperatures (Rind et al., 1990).
The second important annual pattern is one centered on the southwestern North Atlantic (ex: Figure 3A). During the cool season, height variations in this area may be induced by longwave ridging (troughing) over the area or by anomalous STH expansion (contraction) (Davis et al., 1997). In the positive component mode, such variations are related to positive (negative) precipitation anomalies in all of the regions as enhanced moisture advection upstream is supported (Crisp and Lewis, 1992). The negative component mode reflects lower heights near the eastern seaboard cyclogenesis area (Zishka and Smith, 1980) a condition which supports negative precipitation anomalies in all of the regions except those of the extreme east. During warmer months the pattern may reflect STH variations which support increased (decrease) upstream moisture advection and positive (negative) precipitation anomalies in all regions.
The third dominant pattern represents low-latitude pressure changes (ex: Figure 5C). During the positive (negative) component phase, all of the regions record positive (negative) precipitation anomalies. The pattern is suggestive of seasonal insolation variations which may be related to thermal convection over the continental landmasses.
The fourth important pattern relates to mid-continental pressure variations (ex: Figure 3F). The pattern is evident during every season except summer implying longwave forcing and associated ridging and troughing. The positive (negative) component phase is related to negative (positive) precipitation anomalies in the eastern (western) regions as enhanced subsidence (convergence) is induced. Positive (negative) anomalies occur in the west (east) through a condition conducive to increased moisture advection (subsidence) ahead of migratory baroclinic systems.
The last significant annual pattern reflects height variations over
the North Atlantic (ex: Figure 4D). The influence
of the pattern on regional precipitation is position dependent. When the
variation center axis is located over the eastern portion of the grid domain,
all precipitation regions tend to record negative precipitation anomalies.
When the ridge axis is centered over the grid, the eastern regions record
positive precipitation anomalies while the western regions record negative
precipitation anomalies. When the ridge axis is centered over the far western
domain, the mid-continental pattern is present. The positive component
phase may reflect subsidence near the variability axis center and moisture
advection into an upstream trough, thus accounting for the significant
correlations.
CONCLUSIONS
This study attempted to relate downstream pressure variations to upstream regional precipitation variability. Pressure variations over the southwest North Atlantic, as determined by an eigenvector methodology, were related to southern US precipitation regions. Results suggest that cool season circulation patterns were determined to be most important to regional precipitation variability as they reflect variations in the hemispheric longwave flow. However, some patterns may reflect periodic STH expansion and/or strengthening even during the cooler months. During spring, STH expansion and strengthening is well documented, especially during the latter portion of the season (Davis et al., 1997). The summer and autumn principal component patterns reflect this as pressure variations thought to be associated with the STH dominate. It is suggested that pressure variations associated with the downstream STH contribute to precipitation totals in regions of the US south through increased/decreased moisture advection. Upstream conditions must simultaneously be conducive to precipitation forcing during such times. During cool months, such a condition is supported as polar anticyclones migrate through the southern US and exit the continent over the southwest North Atlantic. This condition aids lee precipitation as the return flow (Crisp and Lewis, 1992) sets up a moist, unstable atmosphere in an area of falling geopotential heights/pressures and migratory cyclone passage. During warmer months, the condition is again conducive to higher magnitude precipitation events as the convective process is enhanced under such conditions. Eastern areas, typically the areas near the pressure variation action center, may undergo substantial drying as subsidence increases over the region.
The analysis suggests the importance of downstream pressure variations
on the precipitation variability of the US south. It is felt that these
variations cannot be ignored in estimating future climatic scenarios for
the southern US as recent research (Rind et al., 1990; Davis et al., 1997)
suggests future expansion and strengthening of the North Atlantic STH in
response to increasing hemispheric and global temperatures.
ACKNOWLEDGMENTS
This research was sponsored by the NASA/University Joint Venture (JOVE)
Research Alliance. The author wishes to thank Dr. Keith G. Henderson, Department
of Geography and Anthropology, Louisiana State University, for his contributions
to the manuscript.
LITERATURE CITED
Bluestein, H.B., 1993. Synoptic-Dynamic Meteorology in Midlatitudes, Vol. II, Observations and Theory of Weather Systems. Oxford University Press, N.Y., Oxford. 594 pp.
Brazel, A.J., 1991. Comparisons of RAND climatology and GCM outputs for North and Central America. Pages 116 in L.S. Kalkstein, ed., Global Comparisons of Selected GCM Control runs and Observed Climate Data. USEPA/OPE/CCD, Washington, D.C.
Briffa, K.R., P.D. Jones, and P.M. Kelly, 1990. Principal component analysis of Lamb catalogue of daily weather types: Part 2, seasonal frequencies and update to 1987. Int. J. Climatol. 10:549563.
Buell, C.E. 1975. The topography of the empirical orthogonal functions. Pages 188193 in American Meteorological Society, Preprints, Fourth Conference on Probability and Statistics in Atmospheric Sciences, Tallahassee, FL.
Cattell, R.B., 1966. The scree test for the number of factors. Multivariate Behavioral Research, 1:245276.
Crisp, C.A., and J.M. Lewis. 1992. Return flow in the Gulf of Mexico. Part I: A classificatory approach with a global historical perspective. J. of App. Met. 31:868881.
Dallavalle, J.P., and L.F. Bosart, 1975. A synoptic investigation of anticyclogenesis accompanying North American polar air outbreaks. Mon. Wea. Rev. 103:941957.
Davis, R.E., B.P. Hayden, D.A. Gay, and W.L. Phillips. 1997. The Atlantic subtropical anticyclone. J. Climate 10:4: 728744.
Dunteman, G.H., 1989. Principal Components Analysis. Sage University Paper Series on Quantitative Applications in the Social Sciences, 07-069, Beverly Hills, CA. 92 pp.
Easterling, D.R., 1991. Climatological patterns of thunderstorm activity in south-east USA. Int. J. Climatol. 11:213221.
Hare, F.K. 1985. Climate variability and change. Pages 3768 in R.W. Kates, J.H. Ausubel and M. Berberian, eds., Climate Impact Assessment. John Wiley and Sons Ltd.
Henderson, K.G., and P.J. Robinson. 1994. "Relationships between the Pacific/North American teleconnection patterns and precipitation in the south-eastern USA. Int. J. Climatol. 14:307323.
Henderson, K.G., and A.J. Vega. 1996. Regional precipitation variability in the southern United States. Phys. Geog. 17:2:93112.
Hsu, S.A. 1992. Effects of surface baroclinicity on frontal overrunning along the Central Gulf Coast. J. App. Met. 31:900907.
Kaiser, H.F. 1958. The varimax criterion for analytic rotation n factor analysis. Psychometrika 23:187200.
Kalnicky, R.A. 1974. Climate change since 1950. Annals. Assoc. Amer. Geog. 64:100112.
Keim, B.D. 1997. Preliminary analysis of the temporal patterns of heavy rainfall across the southeastern United States. Prof. Geog. 49:1:94104.
Klein, W.H. 1957. Principal tracks and mean frequencies of cyclones and anticyclones in the Northern Hemisphere. Weather Bureau Research Paper No. 40, US Dept. of Commerce, Washington.
Kunkel, K.E., S.A. Changnon, and J.R. Angel. 1994. Climatic aspects of the 1993 Upper Mississippi River Basin Flood. Bulletin of the American Meteorological Society 75:5:811822.
Lamb, H.H. 1968. The Changing Climate. Methuen, London, 387 pp.
Leathers, D.J., B. Yarnal, and M.A. Palecki. 1991. The Pacific/North American teleconnection pattern and the United States climate. Part I: Regional temperature and precipitation association. J. Climate 4:517528.
Makrogiannis, T.J., A.A. Bloutses, and B.D. Giles. 1982. Zonal index and circulation change in the North Atlantic area, 18731972. J. Climatol. 2:159169.
Muller, R.A. 1977. A synoptic climatology for environmental baseline analysis: New Orleans. J. of App. Met. 16:2033.
Muller, R.A., and J.E. Willis. 1983. New Orleans weather 19611980: A climatology by means of synoptic weather types. Misc. Publ., 83-1, LSU School of Geoscience.
NCAR. 1990. Compact Disc of the National Meteorological Center Grid Point Data Set: Version II. Department of Atmospheric Sciences, University of Washington and the Data Support Section, National Center for Atmospheric Research.
Rind, D., R. Goldberg, J. Hansen, C. Rosenzweig, and R. Ruedy. 1990. Potential evapotranspiration and the likelihood of future drought. J. Geophys. Res. 95:998310004.
Rogers, J.C. 1984. The association between the North Atlantic Oscillation and the Southern Oscillation in the Northern Hemisphere. Mon. Wea. Rev. 112:19992015.
Rohli, R.V., and J.C. Rogers. 1993. Atmospheric teleconnections and citrus freezes in the Southern United States. Phys. Geog. 14:1:115.
Sahsamanoglou, H.S. 1990. A contribution to the study of action centres in North Atlantic. Int. J. of Climatol. 10:247261.
Stahle, D.W., and M.K. Cleaveland. 1992. Reconstruction and analysis of Spring rainfall over the Southeastern U.S. for the past 1000 years. Bulletin of the American Meteorological Society 73:12:19471961.
Vega, A.J. and K.G. Henderson. 1996. On the use of eigenvector analysis in climatological analysis. The Pennsylvania Geographer XXXIV:1:5073.
Vega, A.J., R.V. Rohli, and K.G. Henderson. 1998. The Gulf of Mexico mid-tropospheric response to El Niño and La Niña forcing. Climate Research, in press.
Wang, W.C., and K. Li. 1990. Precipitation fluctuation over semiarid region in northern China and the relationship with El Niño/Southern Oscillation. J. Climate 3:769783.
Weiss, S.J. 1992. Some aspects of forecasting severe thunderstorms during cool-season return-flow episodes. J. of App. Met. 31:964982.
Yarnal, B. 1993. Synoptic Climatology in Environmental Analysis: A Primer. Belhaven Press, London and Florida, 187 pp.
Zishka, K.M., and P.J. Smith. 1980. The climatology of cyclones and
anticyclones over North America and surrounding ocean environs for January
and July, 195077. Mon. Wea. Rev., 108:4:387401.